
20231113-1067 Experimental report on the determination of galactooligosaccharides
Test Report
Chromatography conditions:
Column |
Welch Ultisil®HILIC Amide(4.6×150mm,3μm) |
||||||||||||||||||||||||||||||
Mobile Phase |
0.1% formic acid aqueous solution: acetonitrile |
||||||||||||||||||||||||||||||
Column Temperature |
30℃ |
||||||||||||||||||||||||||||||
Detector |
UV |
||||||||||||||||||||||||||||||
Injection Volume |
10μL |
||||||||||||||||||||||||||||||
Flow Rate |
1.0 ml/min |
||||||||||||||||||||||||||||||
Fluorescence detector |
Excitation wavelength 355 nm, emission wavelength 430 nm |
||||||||||||||||||||||||||||||
Elution procedure |
|
||||||||||||||||||||||||||||||
Note |
/ |
Chromatogram and Data:
1) Blank solution detection spectrum

Serial number |
Retention time (min) |
Peak Area(mAU*min) |
S/N |
Relative peak area(%) |
Resolution (EP) |
Number of plates(EP) |
Asymmetry(EP) |
Sum |
|
0.000 |
|
0.00 |
0.00 |
|
|
2) Sample solution detection chart

Peak name |
Retention time (min) |
Peak Area |
peak area(%) |
Peak height |
Resolution |
Tailing factor |
Number of plates(EP) |
20.030 |
42.03 |
0.30 |
1.99 |
|
|
|
|
20.790 |
76.03 |
0.55 |
3.44 |
|
|
|
|
21.609 |
35.27 |
0.26 |
1.80 |
|
|
|
|
|
22.461 |
13543.59 |
98.05 |
794.89 |
|
|
|
|
24.022 |
66.36 |
0.48 |
2.77 |
|
|
|
|
29.952 |
49.36 |
0.36 |
2.54 |
|
|
|
|
Sum |
13812.63 |
|
|
|
|
|

Peak name |
Retention time (min) |
Peak Area |
peak area(%) |
Peak height |
Resolution |
Tailing factor |
Number of plates(EP) |
19.944 |
39.57 |
0.29 |
1.90 |
|
|
|
|
20.702 |
73.07 |
0.54 |
3.28 |
|
|
|
|
21.524 |
34.44 |
0.25 |
1.73 |
|
|
|
|
|
22.374 |
13253.58 |
98.07 |
801.96 |
|
|
|
|
23.938 |
66.09 |
0.49 |
2.74 |
|
|
|
|
29.869 |
48.06 |
0.36 |
2.56 |
|
|
|
|
Sum |
13514.82 |
|
|
|
|
|
3)Matrix curve (100 μg/mL)

Peak name |
Retention time (min) |
Peak Area |
peak area(%) |
Peak height |
Resolution |
Tailing factor |
Number of plates(EP) |
19.362 |
119.80 |
21.96 |
5.36 |
|
|
|
|
22.333 |
146.82 |
26.91 |
9.86 |
|
|
|
|
27.863 |
74.53 |
13.66 |
4.85 |
|
|
|
|
|
34.294 |
71.50 |
13.11 |
4.81 |
|
|
|
|
39.301 |
53.99 |
9.90 |
3.56 |
|
|
|
|
43.115 |
42.78 |
7.84 |
2.72 |
|
|
|
|
Sum |
545.55 |
|
|
|
|
|
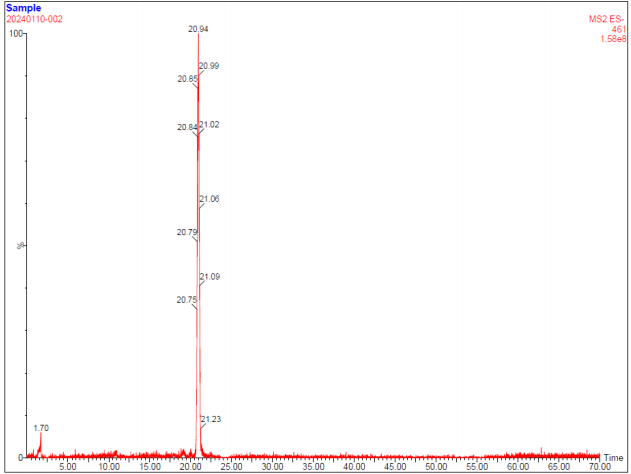
- 4)Liquid mass spectrum (sample)


Conclusion:
Using Ultisil® HILIC Amide (4.6×150mm, 3μm), low-level oligosaccharides in powdered milk are detected. The peak profile of the standard sample matches the national standard, and qualitative analysis of the sample by liquid chromatography only detects maltose (2) at 461.17. This corresponds to the liquid chromatogram and meets the testing requirements.